Investor Insights

SHARE
Will house prices drop once fixed rate mortgages mature?
In this week’s video insight Roger addresses wave of fixed-rate mortgages that will soon revert to much higher rates and the impact this will have on national property prices. So exactly how many mortgages were written and is there actually a cliff we need to worry about?
Transcript
Roger Montgomery: I am trying to get to the bottom of a problem. There’s a lot of talk about a tidal wave of fixed-rate mortgages, established during the historically low fixed rates of 2021, that will soon be reverting to much higher rates. The concern in all the articles I have read is a fiscal cliff will confront a large proportion of borrowers because rates have risen significantly since those mortgages were taken out and consequently house prices could plunge further.
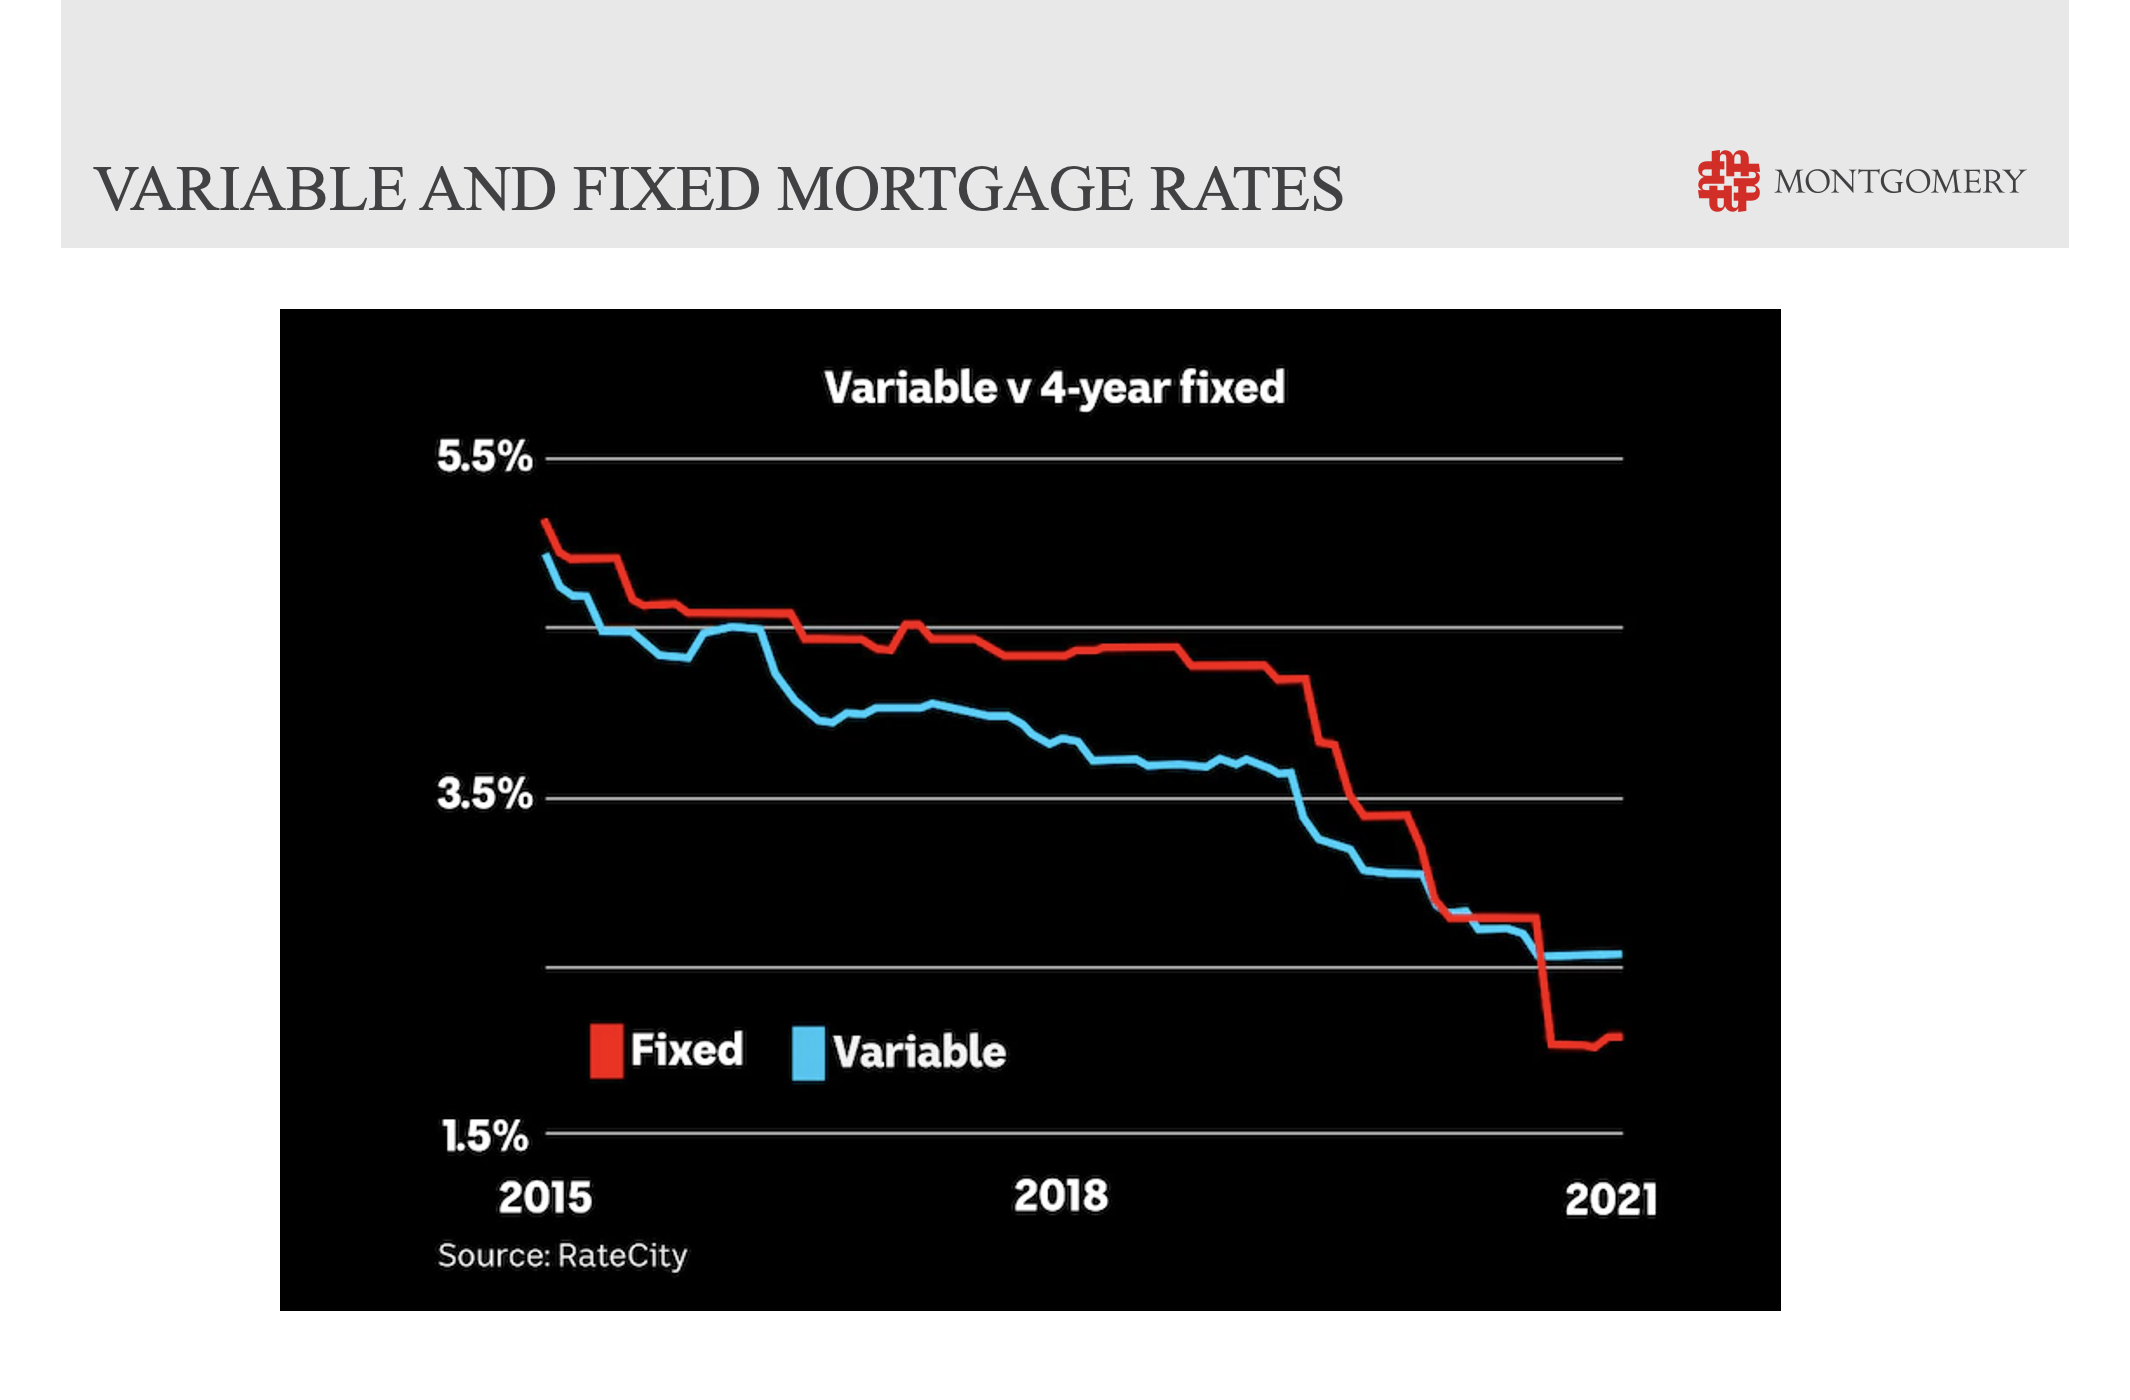
This chart shows fixed-rate mortgage rates dropping below variable around the time the RBA reduced its pricing for its Term Funding Facility for banks on 03 November 2020.

Around the same time there was a shift in the proportion of new mortgages written on fixed rates. Just prior to the pandemic, about 16 per cent of owner-occupier mortgages were fixed and 84 per cent were variable, according to the ABS.
After the repricing of the Term Funding Facility, and all through calendar 2021, fixed-rate mortgages, varied between 33 per cent and 47 per cent of all owner occupier mortgages written.
And that’s where the fear mongering begins. Most articles publishing expert concerns about the plethora of fixed mortgages maturing and triggering a collapse in the property market, look only at the proportion of all mortgages written in this roughly 16-month period.
What I want to know is exactly how many mortgages were written at that time and whether there is actually a cliff we need to worry about.
I started with looking at owner-occupier mortgages because I know that investment mortgages are fewer in number. Whatever result I come up with at the end of exercise I can add a bit more on for investors.
The ABS thinks 799,000 new owner loan commitments were taken out, in total, for construction of dwelling, for newly erected buildings, for existing dwellings and for first home buyers during the 16 months between September 2020 and December 2021.
Of course, the ABS discloses when data excludes refinancing and so from our 799,000 mortgages, we have to adjust for refinancings. You can imagine during this period of ultra-low fixed rates a bunch of people will have renegotiated their mortgages and moved onto those lower fixed rates.
To estimate the proportion of the loans that were refinancings, the ABS also publishes mortgage VALUE data split between new owner house lending and owner refinancing. During the period the proportion of monthly loans that represented refinancing was between 55 per cent and 82 per cent.
If we multiply the number of loans taken out, by the percentage that were genuinely new, we are closer to finding out what percentage of the population, or percentage of total mortgages, the feared tidal wave represents.
Then we need to establish what proportion of the loans were fixed and variable. Fortunately, the ABS provides this data as well. As I mentioned earlier, fixed-rate mortgages as a proportion of total owner mortgages varied between 33 per cent and 47 per cent.
Now before we get to the result, let me say at the outset, working backwards from ABS statistics is going to produce gaping holes thanks to a plague of different time series to try and paint the same picture. But it’s useful to be approximately right.
When I multiply the number of mortgages taken out by owners during the 16-month period in question, by one minus the percentage refinanced, and then by the proportion that were fixed, I estimate the total number of new owner loans taken out in the period in question, that are up for a rate shock, at just 100,304 loans.
Now, there are about 10 million properties in Australia, of which 6 million have mortgages so the proportion we are talking about is just 1.6 per cent. And there are 18,230,032 adults between the ages of 20 and 80, so we are talking about half a per cent of all adults. Even if you say everyone coupled up for their mortgage it is still only 1 per cent. And if we add on investment loans in the same rough proportions for fixed and variable and adjusted for refinancings, you’ll still end up below 2.5 per cent of all mortgages and 2 per cent of the population.
I am of course happy for my back of the envelope calculations to be wrong, but I reckon whatever the final number, we are talking less about a fiscal cliff the nation will be jumping off and more of a fiscal gutter we can step over.

