Investor Insights

SHARE
The winners and losers of 2020
A lot will be written about events in calendar year 2020 and the impact COVID-19 had on many facets of our lives, not to mention the huge volatility in financial markets. Interestingly, when we look in isolation at the calendar year returns of the S&P/ASX 300 Accumulation Index (which includes the returns from dividends), the market was up a tiny 1.4 per cent.
This is despite its 37 per cent peak-to-trough decline in the first part of the year, the S&P/ASX 300 completed 2020 with a just-positive total return thanks to a strong final quarter. As expected though, this volatility resulted in huge divergences within the stocks that make up the index.
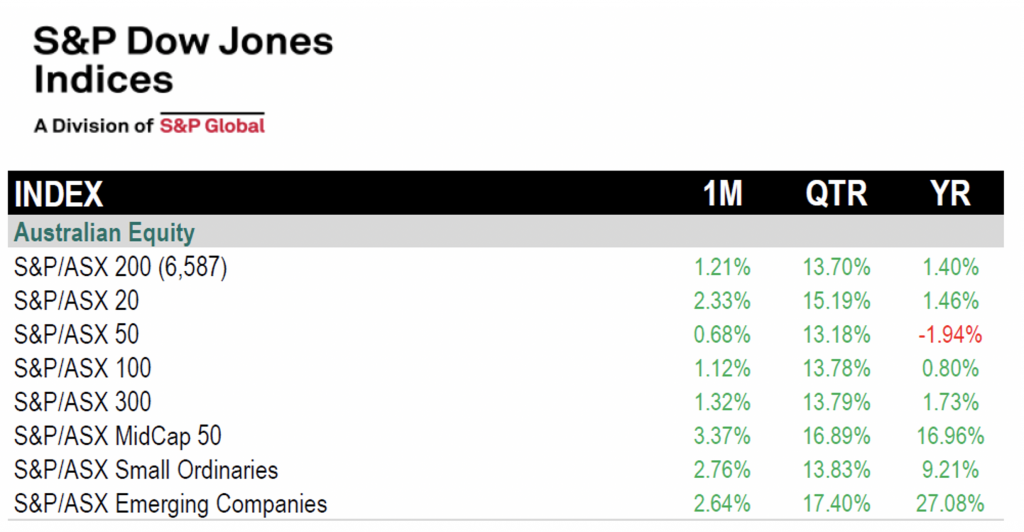
As we can see below, the Top 100 companies in Australia only generated a return of 0.8 per cent for the year whereas the S&P/ASX Small Ordinaries (companies outside the top 100 companies) delivered a 9.21 per cent return. Even more pronounced was returns from the S&P/ASX Emerging Companies Index (generally the microcaps index being stocks from 350 – 600 largest in size) which returned 27.08 per cent last year.
Figure 1.
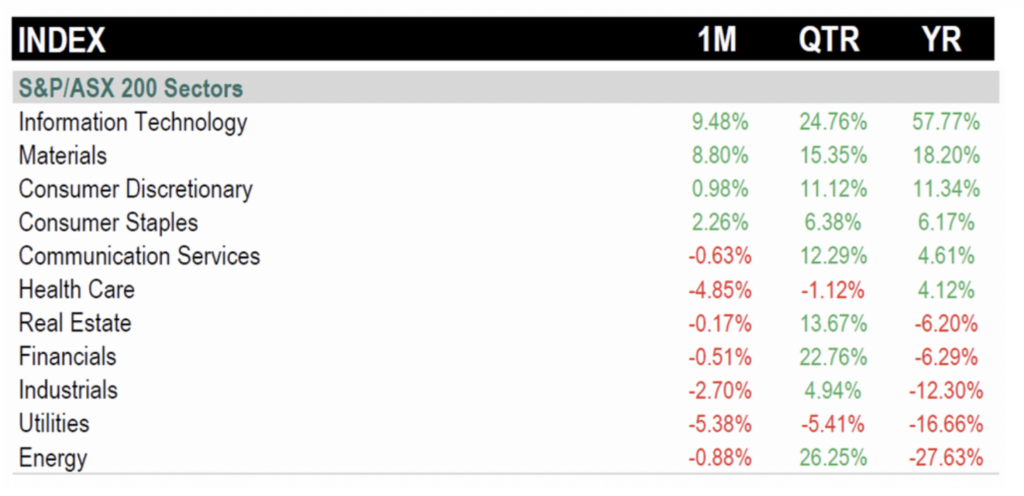
Looking at the individual sector returns within the ASX over the last year, as show in figure 2, we see a very widespread differential between the best (IT with a 57.77 per cent) return compared to worst sector (Energy returning -27.63 per cent) and that was after a 26.25 per cent return in Energy stocks in the last quarter of the year.
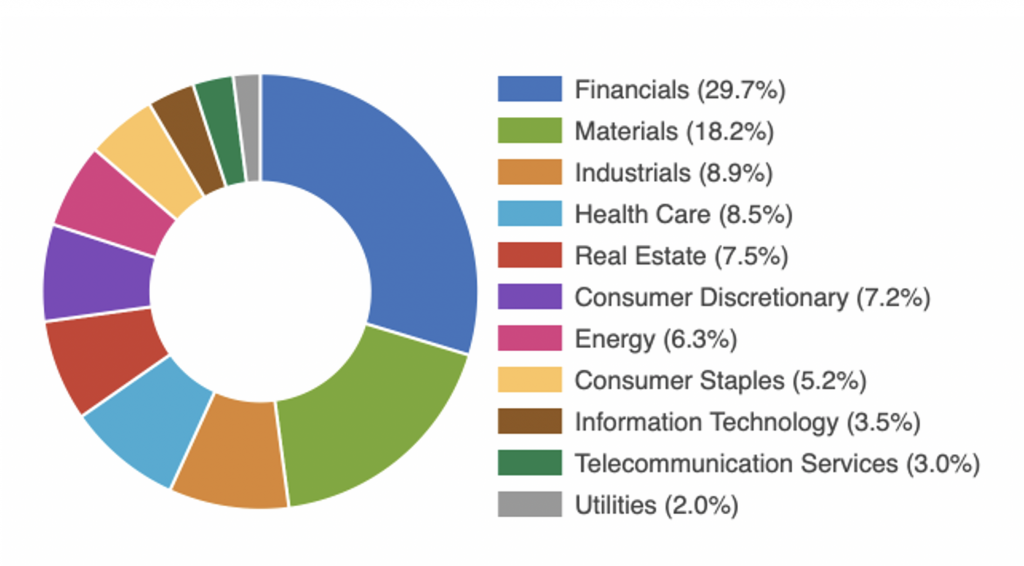
So, if you were fortunate enough to have a heavy weighting to IT stocks in 2020 then you’re probably a happy investor at this point in time. When I look at the weightings of the S&P/ASX 300 index for IT exposure, it shows a weighting of only 3.5 per cent which is why even a huge return from this sector of the market was unable to lift the broader market considerably. Much more emphasis is placed on larger sectors which delivered negative returns such as Financials, Industrials, Healthcare and Real Estate.
Figure 3.
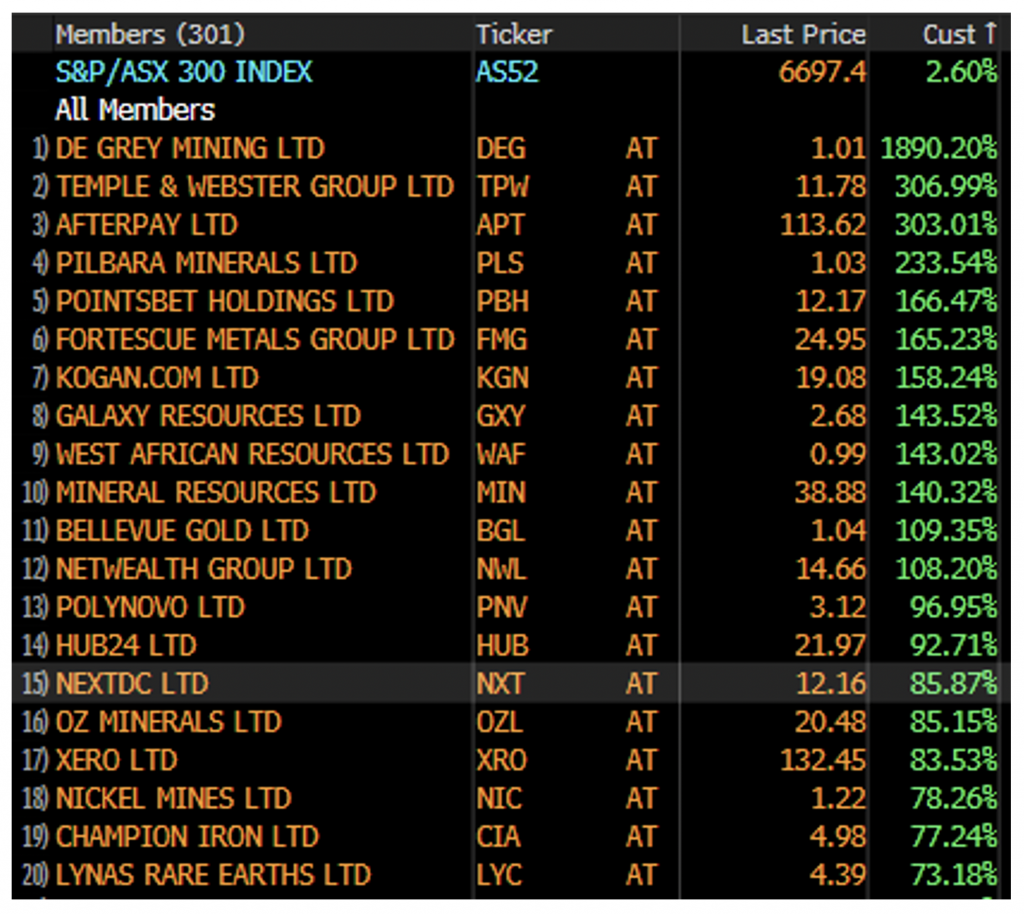
Drilling down to the 20 best performing stocks in the S&P/ASX 300 over the year (Figure 4.), we can see some beneficiaries of key investment themes that played out over the course of the year.
Key themes and beneficiaries:
- Online spending – Temple & Webster, Kogan.com, AfterPay
- Base materials rallying – Fortescue Metals Group, Mineral Resources, OZ Minerals, Nickel Mines, Champion Iron
- Wealth Platforms – Netwealth Group, HUB24
- Rare Earths – Pilbara Minerals, Galaxy Resources, Lynas Rare Earths
Figure 4.
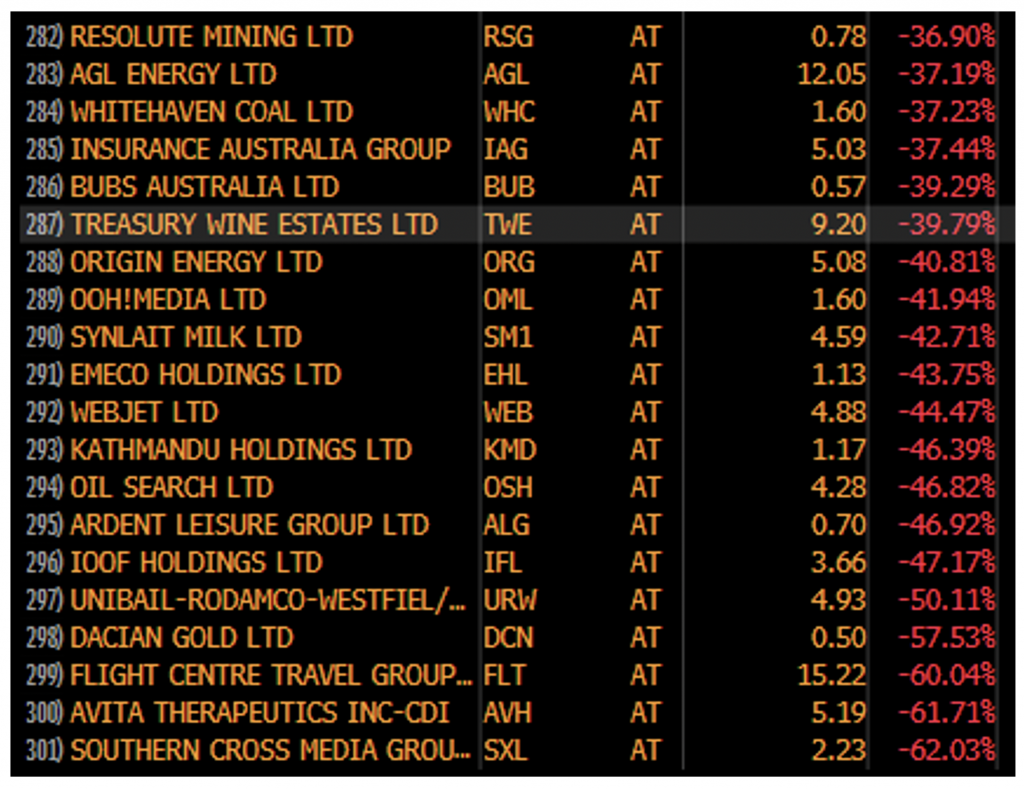
Meanwhile, the bottom 20 stocks in Figure 5 have some consistent themes for businesses exposed to them throughout the year, being:
- Energy – AGL Energy, Whitehaven Coal, Origen Energy, Oil Search
- Travel / Leisure – Webjet, Ardent Leisure, Flight Centre
- Media – OOH! Media, Southern Cross Media Group
Figure 5.
Whether or not these themes continue into 2021 is hard to know, but over the short term, themes can play a huge role in the share price movements of listed companies. However, over the long term, company fundamentals matter more and share prices will generally reflect the economics of the underlying company.


